

Two Speeds in Akron Industrial: 1.2% Vacancy in the Machine Shops, 9% in the Big Boxes
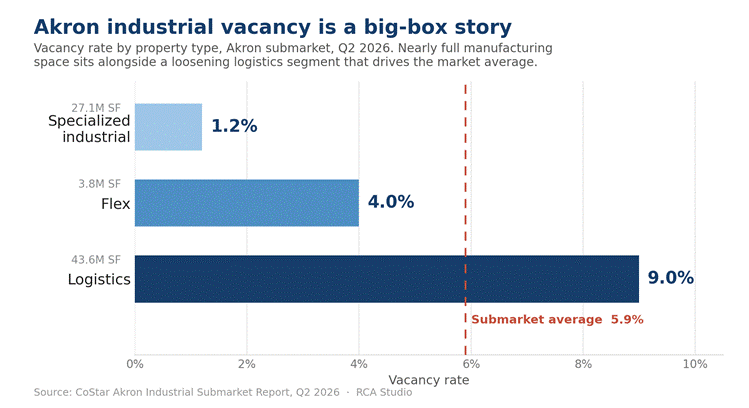
Averaged across 74.5 million SF, Akron’s 5.9% industrial vacancy hides two markets — near-full manufacturing space and a loosening logistics segment. Source: CoStar Akron Industrial Submarket Report, Q2 2026.
Akron’s industrial vacancy rate hit 5.9% in the second quarter, according to CoStar’s submarket data. That’s up from 5.1% a year ago and 2.7% at the 2024 low, so on the headline the market has softened, with vacancy more than doubling in roughly two years and trailing-12-month net absorption running negative at about 138,000 SF.
But the headline buries the story. Averaged across 74.5 million SF, that one number hides two very different markets — and for anyone underwriting a deal here, the split matters more than the average.
The vacancy is almost entirely a big-box problem
Break the submarket into its parts and the divergence is hard to miss:
- Logistics (43.6M SF): 9.0% vacancy, 11.1% availability — the highest in the market and still climbing.
- Specialized industrial (27.1M SF): 1.2% vacancy. Effectively full.
- Flex (3.8M SF): 4.0% vacancy.
So the space that’s empty is overwhelmingly bulk distribution and warehouse product, not the owner-user manufacturing and specialized buildings that make up a third of the market. Specialized industrial at 1.2% is about as tight as a market gets, and it has stayed tight while logistics loosened. That’s not a market in broad retreat; it’s a market digesting a specific kind of supply.
The split is new — and it’s a supply story
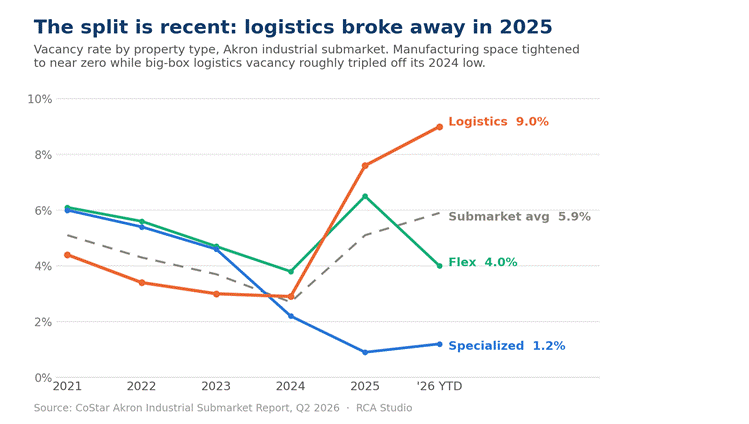
Through 2024 the three property types were converging near 3%. The gap only opened in 2025. Source: CoStar Akron Industrial Submarket Report, Q2 2026.
This divergence is recent. As late as 2024, all three property types were bunched near 3% vacancy. Then logistics vacancy jumped from 2.9% in 2024 to 7.6% in 2025 and 9.0% today, while specialized industrial fell the other way, to under 1% before ticking to 1.2%. A gap that wide, opening that fast, points to supply rather than a broad demand problem.
The supply is real and recent. The past few years brought speculative and build-to-suit bulk deliveries into the submarket — including a roughly 100,000 SF Amazon-occupied facility on Picton Parkway and Ray Fogg’s 250,000 SF building on Seasons Road — and it takes time for a market this size to lease that up. When new big boxes deliver into softening demand, vacancy rises even if nobody is actually shrinking. That looks to be most of what’s happening here.
The pressure valve is that new construction has thinned out. CoStar shows about 193,000 SF under construction and roughly 391,000 SF proposed over the next eight quarters — modest for a market this size, and well below the delivery pace of recent years. The most visible project underway, METRO RTA’s 107,000 SF maintenance facility on Kenmore Boulevard, is public infrastructure, not spec inventory chasing tenants. Limited new supply is the main reason the forecast has vacancy leveling off rather than spiking.
Rents are still positive, which tells you demand hasn’t broken
If this were a genuine demand collapse, asking rents would be rolling over. They aren’t. The submarket average is $6.86/SF, up 1.5% year over year, with specialized industrial up 1.8% and logistics up 1.6% even as its vacancy climbed. Flex, at $12.81/SF, was flat.
For valuation, that’s a bifurcated rent picture, not a falling one. Well-located logistics landlords are likely trading rate for occupancy — expect concessions and free rent that won’t show up in an asking-rent series — so underwriting stabilized effective rents and longer lease-up on vacant bulk space is prudent. Functional manufacturing and small-bay space, where there’s nothing available, is where landlords still hold pricing power.
How it squares with the region
Zoom out and the tension resolves. Cushman & Wakefield pegs the broader Cleveland market at 3.8% vacancy in Q2 2026 — down for the first time in six quarters, with over 1.1 million SF of positive absorption year to date — but names Akron as the region’s weakest submarket and its largest construction pipeline. Both data sets agree on the point that matters: Akron is the soft spot in an otherwise stabilizing region, and it’s soft because of supply, not because the local economy is faltering. Stark County to the south sits at just 2.4% vacancy.
The macro backs that up. Akron’s metro unemployment was 3.7% in June, down from 4.9% in January, with manufacturing employment up 0.8% year over year. The Cleveland Fed’s July Beige Book describes moderate manufacturing growth and robust freight demand across the district, with tariffs nudging some buyers toward domestic suppliers. That’s an economy consistent with 1.2% specialized-industrial vacancy — and it suggests the big-box softness is a timing problem that firmer absorption could work through, if tenant demand reaccelerates. Whether it does is the open question, and the one to watch over the next couple of quarters.
The takeaway for lenders and investors: don’t underwrite the 5.9% blended vacancy as if it describes your specific asset. In this market, property type and lease structure are doing almost all of the work.
Sources
- CoStar, Akron Industrial Submarket Report, Q2 2026 (proprietary; data pulled 8/11/2026)
- Cushman & Wakefield / CRESCO Real Estate, “Cleveland Industrial MarketBeat, Q2 2026” (July 2026)
- Federal Reserve Bank of Cleveland, “Fourth District Beige Book,” July 15, 2026
- U.S. Bureau of Labor Statistics, “Akron, OH — Economy at a Glance” (data through June 2026)
Disclaimer
This article is general market commentary prepared by Rubber City Appraisal Studio, LLC for informational purposes only. It is not an appraisal, valuation, or appraisal review of any property and does not comply with, and is not intended to comply with, the Uniform Standards of Professional Appraisal Practice (USPAP). Nothing here is an opinion of value for any specific asset, nor is it financial, investment, lending, legal, tax, or accounting advice. Readers should not act, or refrain from acting, on the basis of this content and should obtain professional advice specific to their circumstances before making any decision.
The analysis relies on third-party data — including CoStar, Cushman & Wakefield, the Federal Reserve Bank of Cleveland, and the U.S. Bureau of Labor Statistics — that we believe to be reliable but have not independently verified and do not guarantee for accuracy or completeness. All figures, observations, and opinions are current only as of the date of publication; market conditions change, and we assume no obligation to update. Generative AI tools were used to assist with data synthesis and drafting; all content was reviewed and edited by a Rubber City Appraisal Studio appraiser prior to publication.
This article does not create an appraiser-client or any other professional relationship. To engage a USPAP-compliant appraisal of a specific property, contact us directly.