

Distribution Warehouse Update
National Overview, Local Focus
Northeast Ohio Market Signal
This week is all industrial. CoStar’s national bulk distribution report says the big-box glut has peaked and is clearing from the top down. Its Akron submarket report, cut today, shows a market whose vacancy rose for a different reason, whose pricing runs on a different cap rate series, and whose recovery CoStar does not expect to arrive on the national schedule.
Prepared by RCA Studio · Scope: industrial, with capital-markets context · Data current through Q2 2026 (national) / Sept 30, 2026 (Akron)
| THE READ Nationally, vacancy rose because too much got built. In Akron, it rose because tenants left. Akron delivered only 306,000 square feet in twelve months, about 0.4% of inventory, yet logistics vacancy jumped from 2.8% to 8.8% on 1.7 million square feet of negative absorption in 2025. A national supply pause cannot fix a demand problem, and CoStar’s own forecast holds Akron logistics vacancy at 8.0% or higher through 2030.Akron has two cap rates, and the choice between them is the valuation. CoStar’s modeled market rate is 10.3%. The 101 sales that actually closed averaged 7.8%, with a 7.5% median, because what trades is leased and stabilized. A credit-leased Akron building prices close to the 7.4% national bulk figure. Vacant or multi-tenant older stock prices off the model.Both reports predate the rate move. The Fed raised rates to 3.75–4.00% on September 16, and the 10-year Treasury closed at 5.24% on September 28, up 28 basis points in four trading days. Every cap rate in this edition is a second-quarter mark. Treat them as a ceiling on value for a fourth-quarter effective date, not a midpoint. |
01 Big-box vacancy peaked in mid-2025. The top end is healing; the 200,000 to 500,000 square foot middle is not.
INDUSTRIAL · BULK DISTRIBUTION · NATIONAL
| NATIONAL SIGNAL · COSTAR INDUSTRIAL BULK DISTRIBUTION NATIONAL REPORT · JUAN ARIAS · DATA THROUGH Q2 2026, AS OF SEPT 18, 2026 Bulk distribution is warehouse and distribution buildings of 200,000 sf and larger. Vacancy stands at 9.6%, up from 4.1% in 2022. It peaked in mid-2025 and has eased since.Net absorption has outpaced new supply since the second half of 2025: 206M sf absorbed over twelve months. Leased square feet totaled 574M, up 31.5% year over year.The recovery is concentrated at the top end. Properties over 500,000 sf are absorbing space, and vacancy in the 750K+ cohort has fallen to roughly 7%. The 200,000–500,000 sf segment remains above 11%. Its buildings under construction are 70% available, against 40% for larger product.Absorption gains sit in newer buildings with clear heights above 36 feet. Older buildings have posted net move-outs every year since 2023. Sublease space makes up 11% of big-box availability.Median months to lease reached more than 10, up from 6.8 in 2023. Buildings under 200,000 sf run at 6.3% vacancy.Asking rent is $8.50 for 200K+ sf, growing 3.5% a year. Under 200K sf asks $11.41, growing 2.0%. Rents in the 200,000–500,000 sf cohort have doubled over ten years, so expiring leases still roll up sharply even as growth slows.The pipeline stands at 280M sf, down more than 50% from 2022. First-half 2026 starts of 99M sf were the lowest since 2015.Twelve-month sales volume is $34B. Price is $122/sf, up 4.6%, and the cap rate is 7.4%, down 4 bps. Buildings delivered after 2020 traded at 5.5–7.5%. Users are active buyers: Walmart paid $212M ($175/sf) for 1.2M sf in East Hartford, Conn. |
The Northeast Ohio read
The national report’s own market appendix places Cleveland’s bulk segment at 53.6 million square feet with 9.2% vacancy, a $5.82 asking rent, 2.0% rent growth, 416,845 square feet of twelve-month absorption and just 200,000 square feet under construction. Akron is not broken out. The in-state contrast is Columbus, a genuine distribution hub: 201.6 million square feet, 8.7% vacancy, $7.16 rent, 5.7% rent growth and 10.3 million square feet absorbed. Cincinnati runs 6.9% vacancy on 117.3 million square feet. Cleveland’s bulk vacancy is roughly national, but its rent is about a third below the national 200K+ figure and its absorption is about 4% of Columbus’s.
Other national houses measure the whole industrial market rather than bulk distribution alone, and they put vacancy lower. Cushman & Wakefield reported 6.9% for Q2 2026, CBRE 6.5% (its first quarterly decline since Q2 2022), JLL 6.8% and Prologis 7.2%. CoStar’s own all-industrial figure was in the mid-7% range entering the third quarter, and on August 5 CoStar said it expects demand to outpace supply by late 2027. Savills data cited by Bisnow in July matches the size split in the bulk report: 7.3% vacancy for 750K+ sf and 10.9% for 200,000 to 500,000 sf.
Northeast Ohio’s most recent example of the troubled middle cohort is in Stow. Ray Fogg and Brennan Holdings’ 600 Seasons Business Center, 250,211 square feet with 32- to 36-foot clear height and a tax abatement, delivered speculatively in December 2025. As of Fogg’s March 2026 update it was still being marketed for lease. Cushman & Wakefield called it the region’s largest Q4 2025 delivery.
WHAT THIS CHANGES IN A FILE
Size and clear height are now the first sort, ahead of location. The national spread between the 750K+ and 200,000–500,000 sf cohorts is about four points of vacancy. A comparable set that mixes them without adjustment will misstate absorption risk. Clear height belongs in the adjustment grid alongside age, because demand is concentrating in 36-foot-plus product.
Support exposure time with lease-up data, not optimism. Median months to lease for bulk space passed 10 in Q2 2026. For a vacant large-format building, an exposure-time conclusion under a year needs a specific reason.
Mark-to-market on expiring leases is still positive. Asking rent growth has slowed to 3.5%, but rents in the core cohort have doubled over ten years. On a lease signed in 2019 or earlier, the rollover gap is likely wider than current growth rates suggest. Model it explicitly in the income approach.
SPECIAL SECTION · AKRON
02 Akron against the national bulk market: same vacancy headline, different disease
SUMMIT COUNTY INDUSTRIAL · 74.3M SF · COSTAR AKRON INDUSTRIAL SUBMARKET REPORT, SEPT 30, 2026
| LOCAL SIGNAL · COSTAR AKRON INDUSTRIAL SUBMARKET REPORT · SEPT 30, 2026 Over twelve months: 306K sf delivered, −73.3K sf net absorption, vacancy at 5.9%, asking rent growth of 1.4%. The five-year average absorption is about 170,000 sf a year.By type, logistics (42.4M sf) is at 8.8% vacancy and $6.45 rent. Specialized industrial (27.3M sf) is at 1.7% and $6.70. Flex (4.6M sf) is at 3.5% and $11.75.Logistics absorbed −1,696,229 sf in 2025 (−4.0% of inventory) and −595,372 sf so far in 2026. The current quarter was positive at +327,498 sf overall.There are 174,688 sf under construction (0.2% of inventory) and 439,000 sf proposed over the next eight quarters.Twelve-month sales volume is $171.4M across 101 sales. Price per square foot averages $92 with a $50 median. Cap rates average 7.8% with a 7.5% median. CoStar’s modeled market price is $53.91/sf and its modeled cap rate is 10.3%.The median sold building went up in 1971, has 17-foot clear height and one dock. The average sold building is 42,655 sf. |
Side by side
AKRON SUBMARKET VS. U.S. BULK DISTRIBUTION · COSTAR, BOTH SERIES
| Metric | Akron · all industrial | Akron · logistics | U.S. bulk · 200K+ sf | U.S. · under 200K sf |
| Vacancy | 5.9% | 8.8% | 9.6% | 6.3% |
| Vacancy trend | +0.8 pts YTD | +1.5 pts YTD · rising | Peaked mid-2025 · falling | Still rising |
| Asking rent | $6.88 | $6.45 | $8.50 | $11.41 |
| Rent growth, YoY | 1.4% | 1.3% | 3.5% | 2.0% |
| Net absorption | −73.3K sf (12 mo) | −595K sf YTD | +206M sf (12 mo) | n/a |
| Under construction | 174,688 sf · 0.2% | 2,550 sf | 280M sf | n/a |
| Market price / sf | $53.91 | $54.29 | $122 | ≈$137 (chart) |
| Market cap rate | 10.3% | 10.3% | 7.4% | ≈8.2% (chart) |
| Transaction cap rate | 7.8% avg · 7.5% median (12 mo) | 9.0% (YTD, few deals) | 5.5–7.5% (post-2020) | n/a |
| Sales volume | $171.4M (12 mo) | $30.7M YTD | $34B (12 mo) | n/a |
Figures marked “chart” are read from the national report’s charts, not from a printed table, and are approximate. The two CoStar universes differ. The national report counts only warehouse and distribution buildings of 200,000 sf and up, and excludes manufacturing, specialized industrial and flex. Akron’s figures cover all industrial, and most Akron buildings fall below the national report’s size threshold. Akron logistics is the closest like-for-like line.
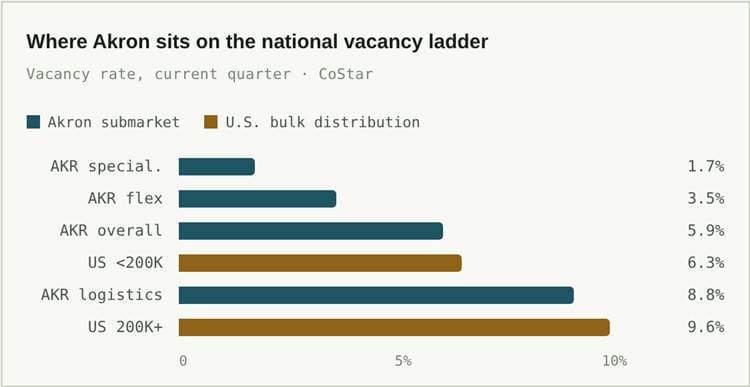
The size-matched comparison is Akron logistics against U.S. buildings under 200,000 square feet, since Akron’s typical sold building is 42,655 square feet. On that basis Akron is 2.5 points worse than the nation. Specialized industrial, which is mostly manufacturing, is the tightest segment in either report.
Where they move together
| AKRON Vacancy is up roughly six points in logistics since 2024.Rent growth has decelerated sharply, from 6.0% in 2023 to 1.4% now.Owner-users are active. Cushman & Wakefield counts 600,491 sf of Akron user sales year to date.New product is taking share from old. Amazon is building 387,860 sf at 2322–2324 Manchester Rd. in Kenmore while its 45,540 sf Gilchrist Rd. building shows 75% vacant. | NATIONAL BULK Vacancy is up 5.5 points from the 2022 low.Rent growth fell from a roughly 14% peak to 3.5%.Users are “particularly active” buyers, with Walmart the headline example.Virtually all absorption is in buildings from the last five years; older stock has posted net move-outs since 2023. |
Where they diverge
The cause. The national vacancy spike was a supply event: supply outpaced absorption from mid-2022 to mid-2025, and it is ending because construction starts collapsed. Akron never had the supply. Its inventory grew 0.4% in 2025 and shrank 0.5% in 2024 on demolitions. The 2025 vacancy jump came from 1.7 million square feet of negative logistics absorption. When supply stops, the national market rebalances. Akron has no supply to stop, so recovery depends on tenants returning. CoStar’s Akron forecast reflects that: logistics vacancy of 8.5% in 2026 and 2027, easing only to 8.0% by 2030.
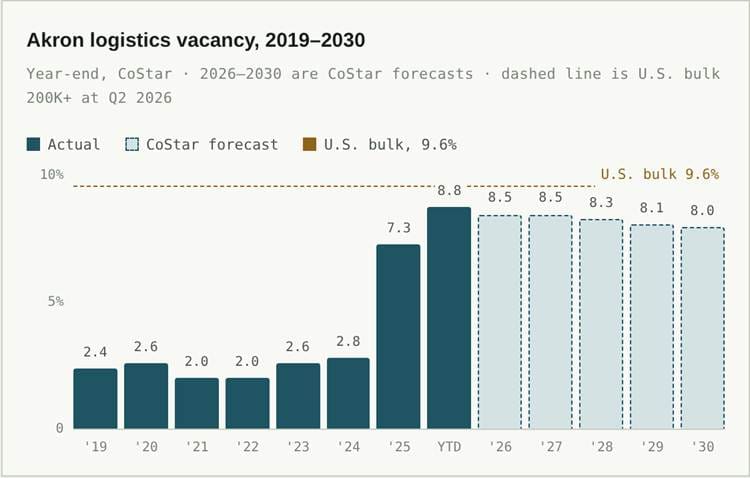
Six years in a 2.0–2.8% band, then a 4.5-point jump in 2025 on −1.70M sf of absorption. National bulk vacancy is falling from its peak. CoStar forecasts Akron logistics roughly flat at an elevated level instead.
The building. National demand is chasing 36-foot-plus clear heights and post-2020 construction. Akron’s typical traded building is a 1971 structure with 17-foot clear height and one dock. The national report’s own vintage chart puts pre-1990 bulk at about $97 per square foot against about $148 for 2020-plus product, a gap of roughly a third based on age alone. That explains much of the distance between Akron’s $53.91 and the national $122. The rest is location and rent: Akron logistics asks $6.45, 24% below the national 200K+ rate and 43% below the national under-200K rate.
The cap rate. This is the divergence that matters most in a file. CoStar models Akron at 10.3%, about 290 basis points above the national bulk 7.4%. But Akron’s actual closed trades averaged 7.8%, and the ones with published rates cluster much closer to national pricing. The FedEx Ground building at 3201 Columbia Rd. in Richfield (233,184 sf, built 2001, FedEx lease through September 2031 per owner Reich Brothers) traded at 7.5%. That rate is indistinguishable from the national bulk figure. A new 10,000 sf Sunbelt Rentals build-to-suit at 1200 Campus Dr. in Stow traded at 6.4% per CoStar, against a 6.00% asking rate on the Sands Investment Group listing. At the other end, 810 Moe Dr. (1969, 28,750 sf) traded at 10.1%. The market is pricing tenancy, not the submarket.
The segment mix. The national report excludes manufacturing and specialized industrial entirely. Those make up 37% of Akron’s inventory and are its strongest segment at 1.7% vacancy. BLS preliminary data for August 2026 shows Akron MSA manufacturing employment of 37,100, up 1.4% year over year. Trade, transportation and utilities is down 0.4%. Local job trends match the vacancy split: makers are holding, distribution is shedding.
AKRON SALES WITH A PUBLISHED CAP RATE OR NOTABLE PRICING, TRAILING 12 MONTHS (COSTAR)
| Property | Built · sf | Date | Price · $/sf | Cap | Note |
| 142 Goodyear Blvd. | — · 193,312 | 10/31/2025 | $74.8M · $387 | — | Identity unverified, see conflicts |
| FedEx Ground, 3201 Columbia Rd., Richfield | 2001 · 233,184 | 11/17/2025 | $23.0M · $99 | 7.5% | Single-tenant credit; lease to Sept 2031 |
| 1200 Campus Dr., Stow | 2025 · 10,000 | 6/24/2026 | $5.5M · $550 | 6.4% | Sunbelt Rentals NNN to 2035; listing asked 6.00% |
| 5127 Boyer Pkwy. | 2007 · 46,800 | 12/2/2025 | $5.0M · $107 | 7.2% | |
| 4246 Hudson Dr. | 1999 · 44,184 | 1/23/2026 | $3.8M · $86 | 7.9% | |
| 810 Moe Dr. | 1969 · 28,750 | 7/8/2026 | $2.1M · $74 | 10.1% | Oldest cap-rate comp; widest rate |
| 250 S. Van Buren Ave. | 1953 · 88,482 | 1/19/2026 | $1.55M · $18 | — | Low end of the $/sf range |
Construction also runs differently. Nationally, developers are replanning mid-size sites to demise for smaller tenants. In Akron, the entire pipeline CoStar lists is three buildings: a transit maintenance garage, a freezer-cooler build-to-suit and a 2,550 sf office-warehouse. Nothing in it is speculative. The next wave is 391,000 square feet proposed for mid-2028 at 3150 Gilchrist Rd., 1210 Massillon Rd. and 120 Cole Ave. Both lists have record problems, covered in the conflicts box below.
WHAT THIS CHANGES IN A FILE
Pick the cap rate series by tenancy, then say so. For a leased, single-tenant, credit building, Akron’s closed trades (6.4–7.9%) and the national bulk series (7.4%) are the right evidence. CoStar’s 10.3% model would undervalue it. For vacant, multi-tenant or pre-1980 product, the model and the 10.1% Moe Dr. trade are closer to the market. A single blended rate serves neither case. Then add the rate-move discussion in Section 03 on top.
Use a vacancy allowance specific to the property type, not the submarket headline. The 5.9% blended figure understates warehouse risk (8.8%, forecast at 8.0% or higher through 2030) and overstates manufacturing risk (1.7%). Use national rent growth assumptions only with an explicit reason. CoStar forecasts Akron logistics rent growth at 0.9% for 2026 and 1.4% for 2027.
Strip the outlier before quoting averages. One $74.8 million sale at $387 per square foot is 44% of the trailing-twelve-month dollar volume. It is also why the $92 average price per square foot is almost double the $50 median. Quote the median, or recompute without that sale, and note which you used.
Adjust for functional utility explicitly when using out-of-market comparables. A Columbus or national bulk comparable at 36-foot clear height does not substitute for a 17-foot Akron building without a functional adjustment. The national data shows older, lower buildings losing tenants even while the market recovers.
03 The rate backdrop moved after both reports were cut
CAPITAL MARKETS · CAP RATE TIME ADJUSTMENT
The Federal Open Market Committee raised the federal funds target range a quarter point to 3.75–4.00% on September 16, 2026, by a 12–0 vote. It was the first increase since 2023, and the median projection implies one more before year-end. The 10-year Treasury went from 4.96% on September 22 to 5.24% on September 28, per the Federal Reserve’s H.15 release. Prime is 7.00%. The national bulk report’s data runs through Q2 and was compiled September 18. Its “−4 bps” twelve-month cap rate change predates all of this.
CAP RATE SPREAD OVER THE 10-YEAR TREASURY (5.24%, SEPT 28, 2026)
| Series | Cap rate | Spread |
| U.S. bulk 200K+ (CoStar market) | 7.4% | 216 bps |
| Akron closed trades, 12-mo average (CoStar) | 7.8% | 256 bps |
| Akron market (CoStar model) | 10.3% | 506 bps |
The thinnest spread is on the national bulk figure and on Akron’s credit-leased trades that price like it. Those are the assets most exposed to repricing if the 10-year holds above 5%. Akron’s modeled 10.3% already carries a wide cushion.
Trade policy remains unsettled for distribution demand. The Supreme Court struck down the IEEPA tariffs in February 2026. Section 301 tariffs of 10–12.5% on about 60 economies replaced the expired Section 122 tariffs on July 24. A 50% tariff on roughly $20 billion of Canadian imports took effect August 23, and Canada retaliated September 8. Customs’ refund process for the struck-down tariffs opens its third phase October 6.
WHAT THIS CHANGES IN A FILE
For a fourth-quarter effective date, a Q2 cap rate needs a time discussion. Neither CoStar series shows the September move yet. Where the conclusion rests on a rate within about 250 basis points of Treasuries, say whether the rate was tested against post-September financing terms, and consider a sensitivity range rather than a point.
04 Since Edition 001: data centers and power
CARRIED-FORWARD ITEMS
- Shalersville Twp. The zoning commission voted September 10 to reclassify any use drawing 25 MW or more, or projecting noise past the lot line, as heavy industrial. The township has no heavy industrial zoning, and light industrial is now capped below 25 MW. That puts the 750 MW Bitdeer/Geis proposal in direct conflict with the code. The developers have asked for a 10 dB allowance over ambient noise, and the township ordered an acoustic study. Public hearing October 6. (The Portager, Sept 18)
- FirstEnergy data center tariff. The biggest open gap from Edition 001 is partly closed. FirstEnergy filed Schedule DCT on June 15, 2026 (PUCO case 26-0697-EL-ATA). It sets a minimum bill at the higher of 85% of contract capacity or actual usage, and requires competitive supply. Contract length and exit fees are still not publicly verified, and EEI’s September list does not say whether PUCO has approved the filing. Figures of 85% over twelve years that circulate online describe AEP Ohio’s tariff, not FirstEnergy’s.
- Weathersfield Twp. (Trumbull) extended its data center moratorium six months, into April 2027, while rules are drafted. (Tribune Chronicle, Sept 14)
- Ultium Cells, Lordstown restarted production August 17 after a seven-month pause, with about 1,400 workers against roughly 2,200 at peak. (WFMJ, Aug 17)
05 Dates that will move these numbers
WATCH LIST
| Oct 6, 2026 | Shalersville Township public hearing, 7 p.m., on the 25 MW heavy-industrial reclassification. Also the day CBP opens Phase 3 of its IEEPA tariff refunds. |
| Mid-Oct 2026 | Q3 2026 broker industrial reports (Cushman & Wakefield, Newmark, CBRE, JLL). They are the first read that includes the September rate move, and a chance to reconcile the Akron pipeline conflict. |
| Oct 27–28, 2026 | Next FOMC meeting. The September projections implied one more hike in 2026. |
| Early Nov 2026 | Shalersville moratorium expires. Whether the September zoning amendments are adopted first decides whether Bitdeer/Geis has a permitted path. |
| Nov 30, 2026 verify | PUCO staff report in FirstEnergy’s rate case, as carried from Edition 001. The date is unconfirmed on the public docket. |
| Dec 31, 2026 or July 5, 2027 | Lordstown Village moratorium end, depending on which extension is current. The Bristolville 25 mandamus is still pending at the Ohio Supreme Court. |
| Jan 2027 | 2026 reappraisal values reach tax bills: Summit about +18%, Ashtabula about +30%. Board of Revision hearings open. |
| Apr 2027 | Weathersfield Township data center moratorium expires. |
| Late 2027 | CoStar’s projected turn, when national industrial absorption overtakes new supply. For Akron, CoStar’s forecast shows no equivalent turn in logistics. |
| Mid-2028 | Three proposed Akron buildings totaling 391,000 sf (150,000 at 3150 Gilchrist, 150,000 at 1210 Massillon, 91,000 at 120 Cole) are slated for June 2028 completion, pending confirmation of the records. |
Sources
SOURCE REPORTS (SUPPLIED)
- CoStar, Industrial Bulk Distribution National Report, Juan Arias, National Director of US Industrial Analytics; data through 2026 Q2 as of Sept 18, 2026 (supplied PDF, licensed; not publicly linkable)
- CoStar, Akron Industrial Submarket Report, Sept 30, 2026 (supplied PDF, licensed to Rubber City Appraisal Studio; not publicly linkable)
- CoStar, “CoStar Expects U.S. Industrial Demand to Outpace Supply by Late 2027,” Aug 5, 2026
- CoStar, “U.S. industrial vacancy rates across newer, larger properties begins to compress,” June 16, 2026
NATIONAL INDUSTRIAL
- Cushman & Wakefield, U.S. Industrial MarketBeat Q2 2026, July 17
- CBRE, Q2 2026 U.S. Industrial & Logistics Figures, July 29
- JLL, U.S. Industrial Market Statistics & Trends, Q2 2026
- Prologis Q2 2026 earnings call transcript, July 16
- Bisnow, “The Glut Of Big-Box Warehouses Is Finally Getting ‘Gobbled Up’,” July 15, 2026
AKRON & CLEVELAND INDUSTRIAL
- Cushman & Wakefield CRESCO, Cleveland Industrial MarketBeat Q2 2026 (Akron submarket)
- Cushman & Wakefield CRESCO, Cleveland Industrial MarketBeat Q1 2026
- Cushman & Wakefield CRESCO, Cleveland Industrial MarketBeat Q4 2025
- Newmark, Cleveland Industrial Market Overview 2Q26
- REBusinessOnline, “Northeast Ohio Industrial Market Turns a Corner,” Sept 3, 2026
- Fogg, “Construction Complete at 600 Seasons Business Center”
- Signal Akron, Amazon Kenmore facility, Nov 21, 2025
- Akron Beacon Journal (via AOL), Hillandale Farms move to Picton Pkwy., Feb 6, 2024
- METRO RTA, Maintenance & Operations Facility
- Signal Akron, METRO transit projects, Mar 26, 2025
- BLS, Akron MSA Economy at a Glance
AKRON TRANSACTION VERIFICATION
- Reich Brothers, 3201 Columbia Rd., Richfield
- Sands Investment Group, Sunbelt Rentals, Stow (sold)
- LoopNet, 142 Goodyear Blvd. property record
- Goodyear, “Goodyear Completes Divestiture of Chemical Business,” Nov 3, 2025
- Signal Akron, Akron chemicals research office sale, May 23, 2025
- Marcus & Millichap, JRayl sale-leaseback listing
- JLL, 2100 International Pkwy., North Canton
- ICP, 1210 Massillon Rd.
- CommercialSearch, 120 Cole Ave.
RATES & TRADE
- Federal Reserve, H.15 Selected Interest Rates, Sept 29, 2026
- Advisor Perspectives, Fed decision, Sept 16, 2026
- J.P. Morgan Asset Management, FOMC statement, Sept 2026
- Federal Reserve, FOMC meeting calendar
- Dimerco, U.S. tariff update 2026
- Holland & Knight, Supreme Court strikes down IEEPA tariffs, Feb 2026
DATA CENTERS, POWER & CARRIED ITEMS
- The Portager, Shalersville zoning changes, Sept 18, 2026
- News 5, Shalersville 257-acre project, June 17, 2026
- EnergyChoiceMatters, FirstEnergy Schedule DCT filing, June 15, 2026
- RTO Insider, PUCO orders FirstEnergy data center tariff, May 2026
- Ohio Consumers’ Counsel, FirstEnergy rate case 26-0347-EL-AIR
- WFMJ, Lordstown data center case, June 2026
- WFMJ, Lordstown moratorium committee zoning proposal, Aug 2026
- Tribune Chronicle, Weathersfield moratorium extension, Sept 14, 2026
- WFMJ, Ultium Cells restart, Aug 17, 2026
- WYSU, 2026 reappraisals, Aug 6, 2026
- Signal Akron, Summit County informal reviews, Aug 19, 2026
Compiled September 30, 2026 from the two CoStar reports plus public sources. National bulk distribution data is current through Q2 2026 as of September 18. Akron submarket data is as of September 30. Rate data is current to September 28. Figures are reported as published by each source and have not been independently verified against county records. This brief is market commentary, not an appraisal, and is not intended to be relied upon as a valuation of any specific property.